Certificate
This layout can be customised. The page below describes it as shipped. To adapt it for a specific purpose, build the arrangement you want as a template in Dashboard > Home — adding, removing, arranging and configuring widgets — then choose Update > Save as Layout and pick this page. Saving replaces this page's layout for every user and the previous arrangement is not kept, so it needs the layout-update permission held by administrators. See Publishing a Template as a Layout.
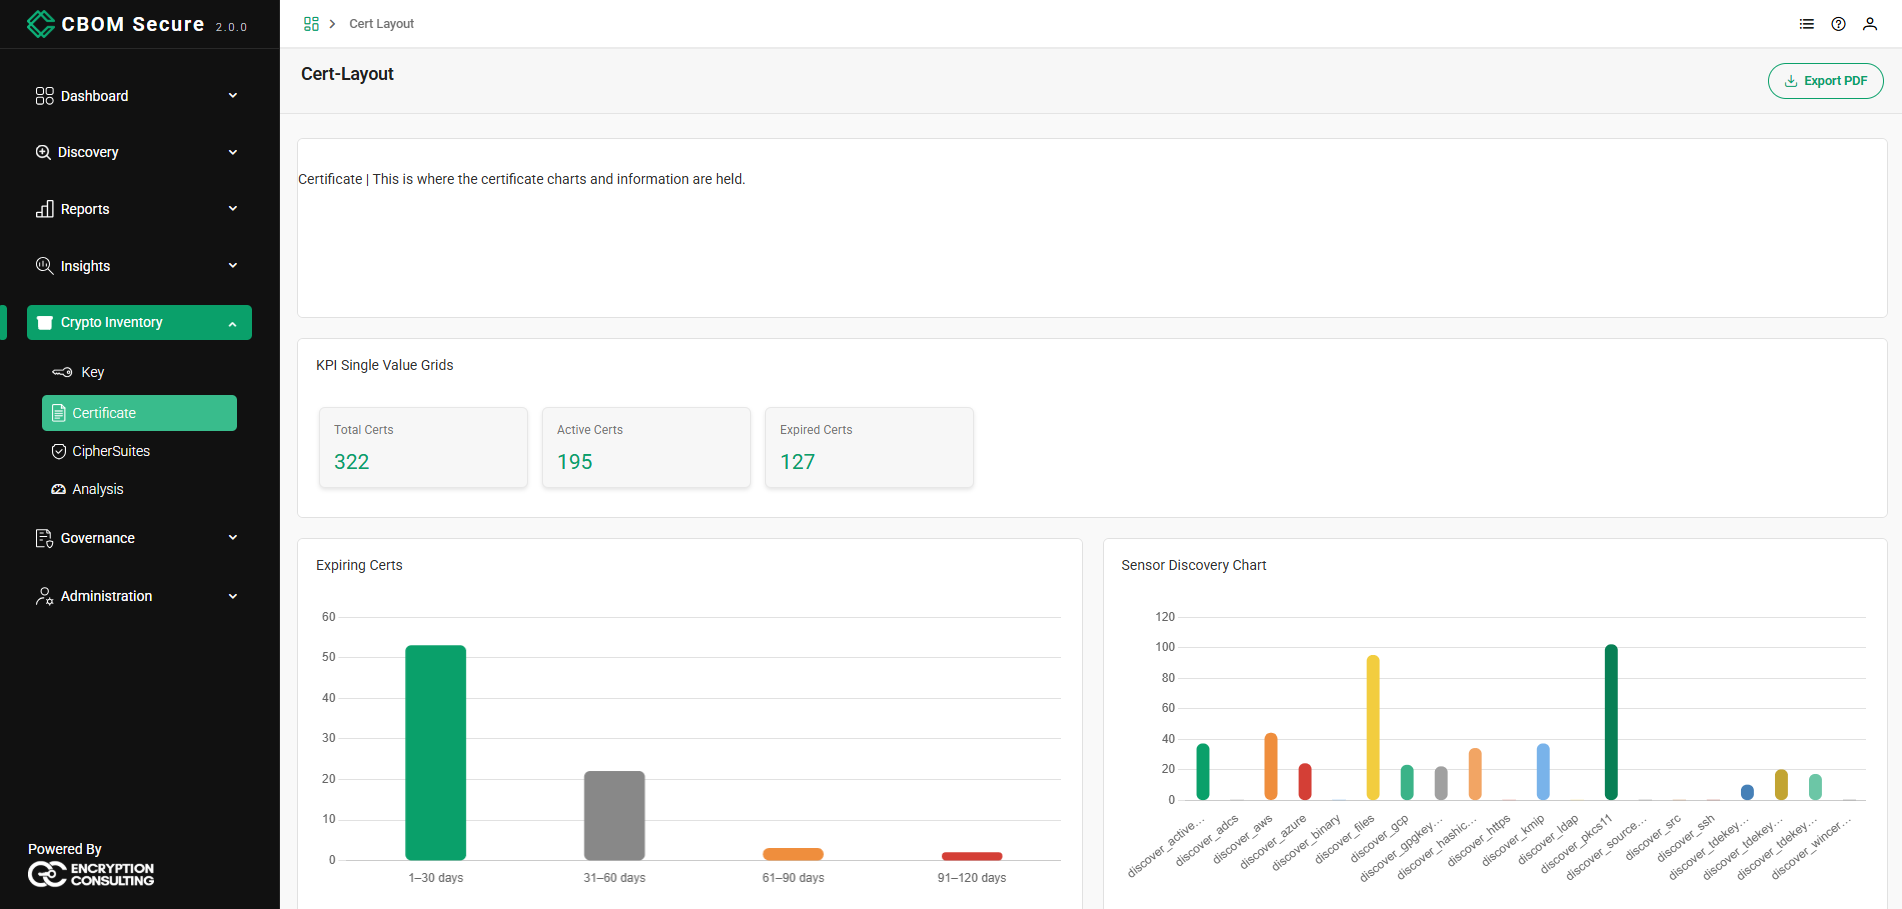
The Certificate page is where the certificate charts and information are held. It consolidates the digital certificates discovered across your environment into high-level totals, an expiry chart, a discovery breakdown by sensor and a table of the individual certificates — a complete view of the certificate inventory and its health. The page is reached from Crypto Inventory > Certificate in the left navigation menu, and the shipped layout is named Cert-Layout.
An Export PDF button at the top right renders the page to a PDF named after the layout.
KPI Single Value Grids
The page opens with a text widget introducing it (Certificate | This is where the certificate charts and information are held.) and then a row of single-value cards summarising the certificate inventory. Each card is one KPI chosen from the platform's catalogue, so the set on your dashboard is configurable; the shipped selection is:
-
Total Certs: Every certificate in the inventory.
-
Active Certs: Certificates already valid and not yet expired.
-
Expired Certs: Certificates that have passed their expiry date.
Expiring Certs
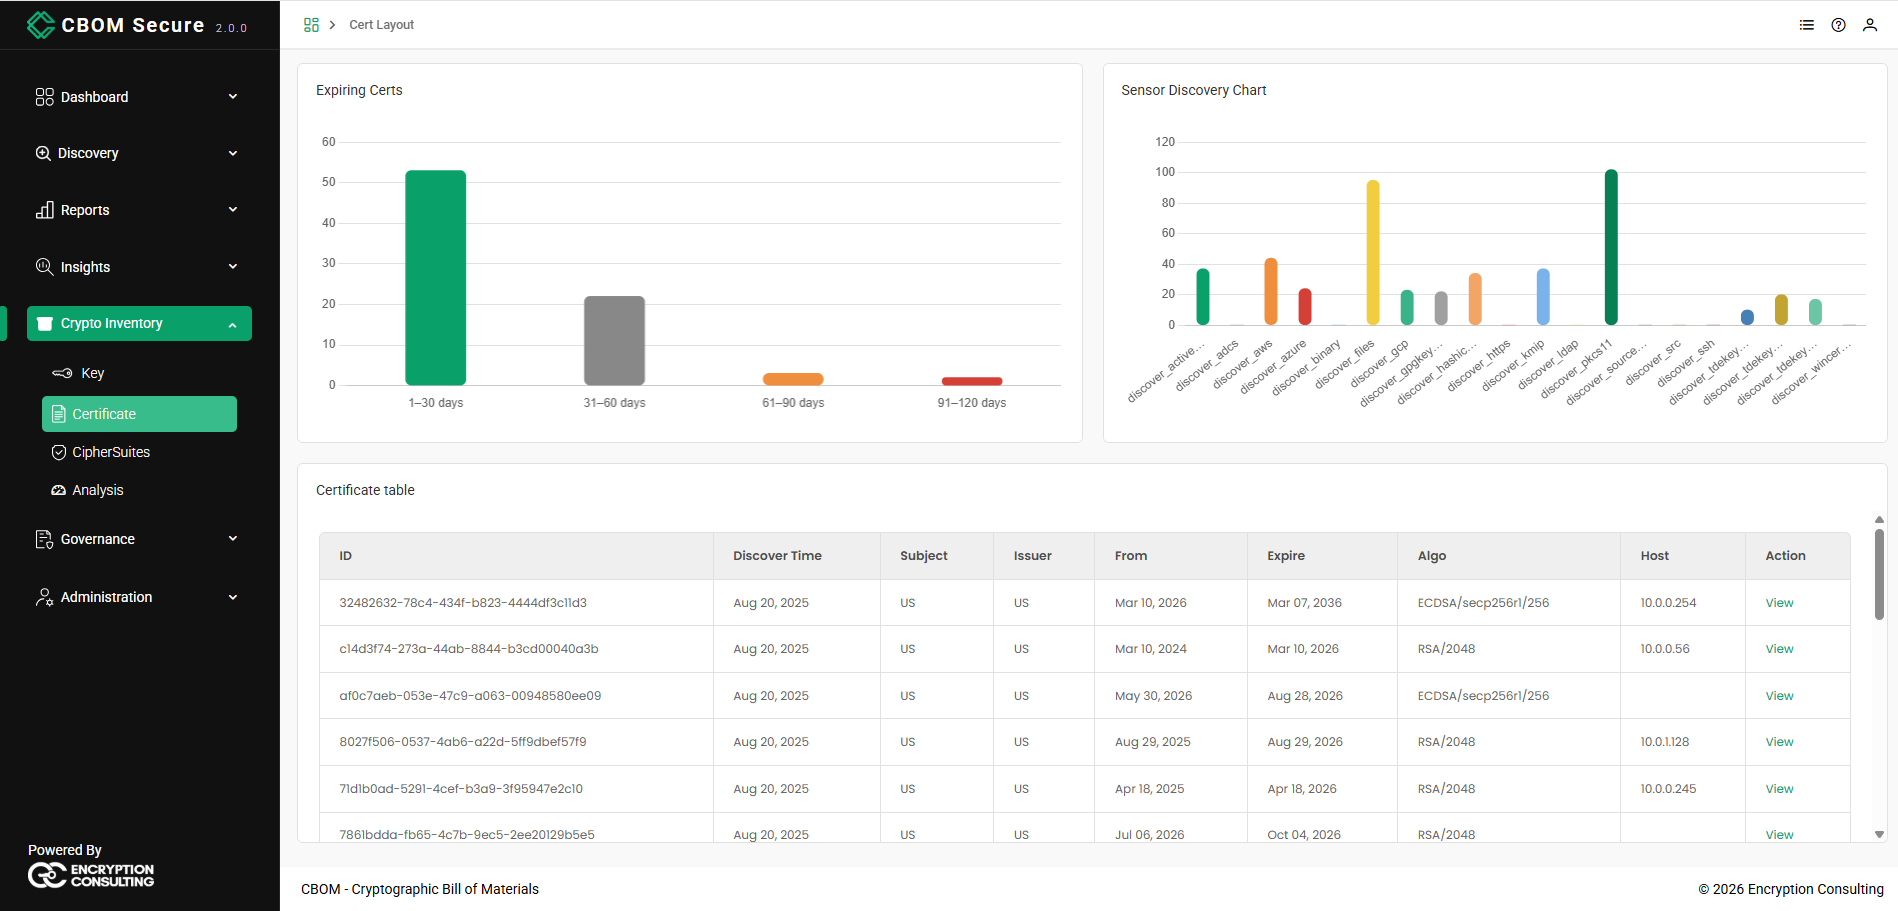
The Expiring Certs chart groups certificates by how soon they expire, using time buckets — 1–30 days, 31–60 days, 61–90 days and 91–120 days. This makes it easy to spot certificates that need renewing and to plan ahead before they cause a service disruption.
The window is not fixed: the widget's configuration takes a Days horizon, a Starting Day and a Group By bucket size, so an instance can span five weeks in weekly buckets or a year in monthly ones. A layout may place the widget more than once with different horizons.
Sensor Discovery Chart
The Sensor Discovery Chart shows how many certificates each sensor discovered, one bar per sensor: discover_activedirectory, discover_adcs, discover_aws, discover_azure, discover_binary, discover_files, discover_gcp, discover_gpgkeyrings, discover_hashicorpvault, discover_https, discover_kmip, discover_ldap, discover_pkcs11, discover_sourcecode, discover_src, discover_ssh, discover_tdekeys_mssql, discover_tdekeys_mysql, discover_tdekeys_oracle and discover_wincerts.
The axis lists every sensor that has contributed at least one document to the inventory, while the bar heights count only the material type the instance is configured for. A sensor can therefore appear with an empty bar — it found material, but none of the requested type. Clicking a bar drills into the table of the certificates that sensor found.
Certificate Table
The Certificate table lists the individual certificates in the inventory. Each row carries:
-
ID: The certificate's identifier in the inventory.
-
Discover Time: When the certificate was first collected.
-
Subject: The entity the certificate was issued to.
-
Issuer: The entity that issued the certificate.
-
From / Expire: The certificate's validity period — its start and expiry dates.
-
Algo: The signing algorithm and strength (for example RSA/2048 or ECDSA/secp256r1/256).
-
Host: The host the certificate was found on. It is blank where the certificate came from a source that is not tied to one machine.
-
Action: A View link that opens the certificate in full.
The table is paginated with the shared paginator described in Dashboard Operations, and its header row sorts.